

Admissions Data Suggests W&L Has a Marketing Problem
By Paul Lagarde '16 Editor's Note: Some of the data in this article was incorrect as originally released. Based on information from a well-placed source, the author believed the number of waitlisted students admitted to be the same number as those who actually enroll. That is not the case however, and the article and charts have been amended to reflect this change. We sincerely apologize for the mistake.
Every year, the Washington and Lee Office of Institutional Effectiveness releases what is known as the Common Data Set, a collection of data related to University programs such as admissions, academics, and financial aid. Based on the data available regarding admissions and enrollment, it appears that in 2015 Washington and Lee had some trouble convincing students accepted under Regular Decision to actually enroll.
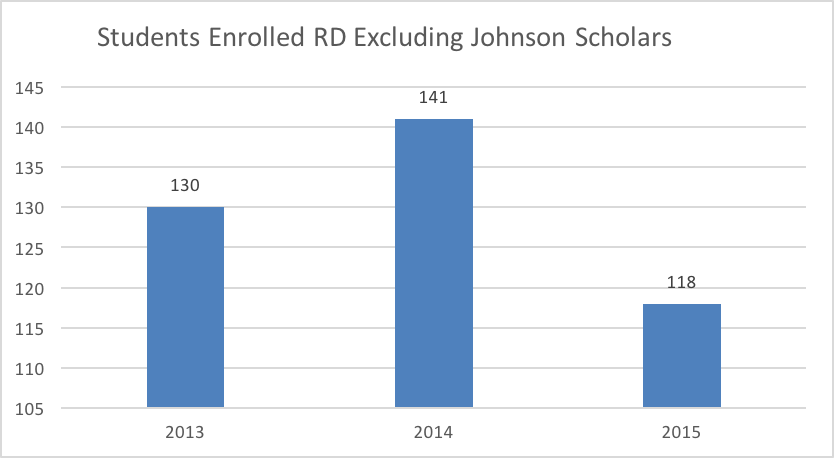
Since 2013, excluding 40 or so Johnson Scholars each year, W&L has filled incoming freshman classes with an average of 136 students admitted under Regular Decision. In 2015, however, W&L managed to convince just 118 students from the Regular Decision pool to enroll, despite extending offers of admission to 876 students from Regular Decision.
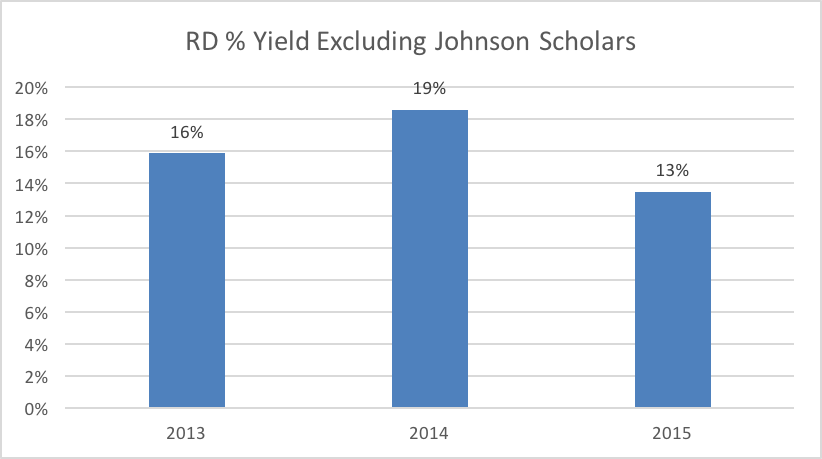
This constitutes a 13% yield on RD enrollment, a 32% decrease from 2014's 19%. Despite an increase in available financial aid, notably in the inception of the “W&L Promise” which guarantees full tuition to any student with a household annual income of less than $75,000, this discrepancy makes one wonder why W&L struggled so much to attract students last year.
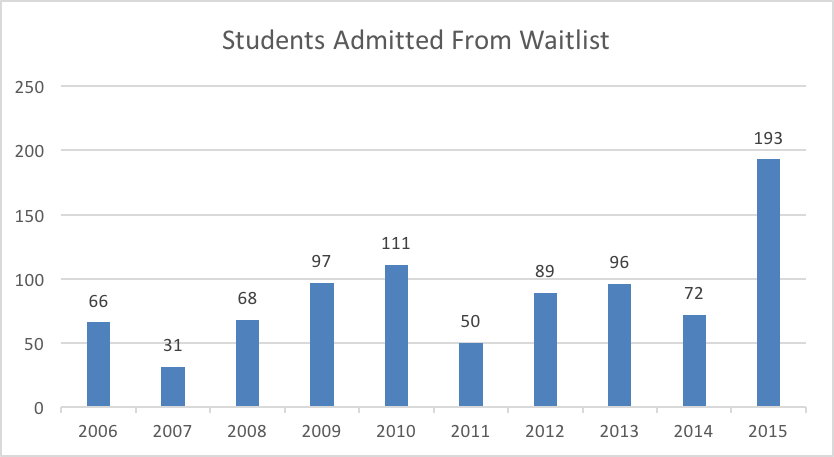
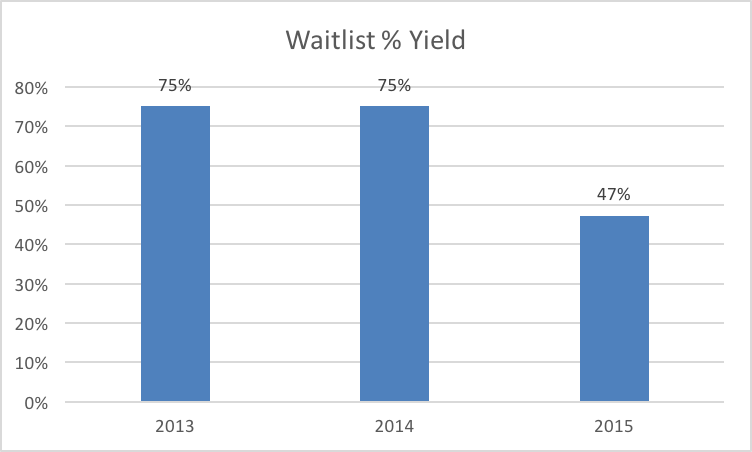
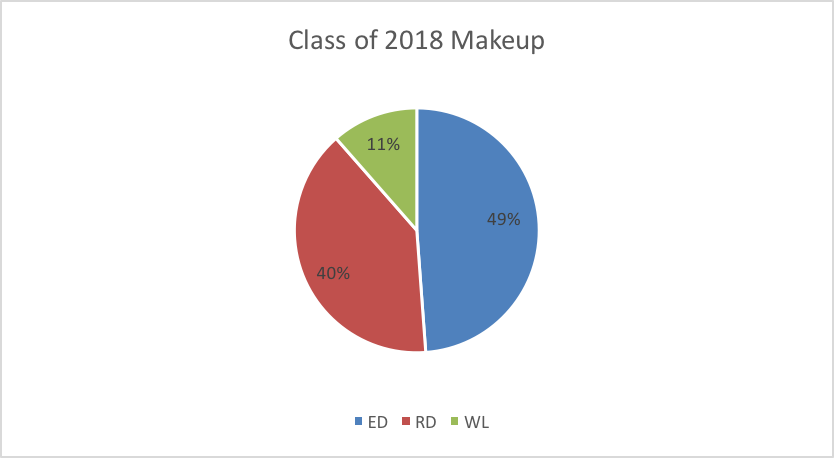
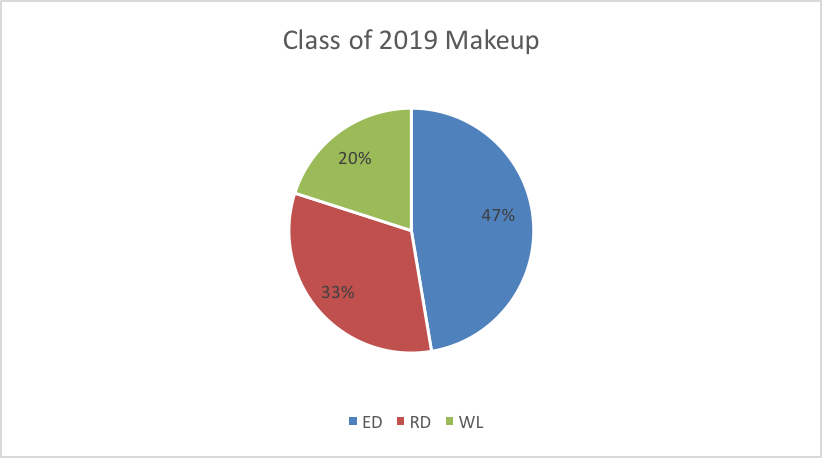
In order to make up for the unusually low Regular Decision haul, W&L admitted far more waitlisted students than usual in 2015. As the following charts illustrate, W&L had to almost triple the number of students it accepted off the waitlist from 2014 to 2015, ultimately filling the Class of 2019 with 91 waitlisted students, for about 20% of the overall class. It is worth noting that in 2013 and 2014, W&L managed to enroll 75% of students given offers on the waitlist. In 2015, that yield dropped to 47%.
This is not to suggest that the quality of the Class of 2019 suffered as a result of an increased number of students admitted off the waitlist; on the contrary, the class compares favorably to other W&L classes in terms of grades and standardized test scores. What these statistics do suggest, however, is that W&L failed to convince many of those admitted under Regular Decision to ultimately choose W&L as their alma mater. While the reasons behind this are not clear, it seems safe to assume that financial factors are not to blame for this drop, as the University has improved financial aid offerings each year. What seems more likely are W&L admissions initiatives that target more nontraditional students than usual, perhaps hoping to improve the diversity of the student body. Those pitches apparently did not go well, and as a result the admissions office had to scramble to fill the class.
 While W&L was able to salvage the Class of 2019 through the waitlist, this seems an unsustainable practice moving forward. If the University wishes to attract more students under Regular Decision, it clearly needs to improve its sales pitch. W&L likely spent a substantial amount of money convincing Regular Decision students to enroll, and in today’s age of sky-high tuition prices, there is little room for this kind of administrative waste. Admissions in 2016 for the entering class of 2020 will provide further telling information, indicating whether 2015 was just a fluke year in enrollment statistics or a sign of trends to come. Hopefully the new Dean of Admissions Sally Stone Richmond and her team are up to the challenge.